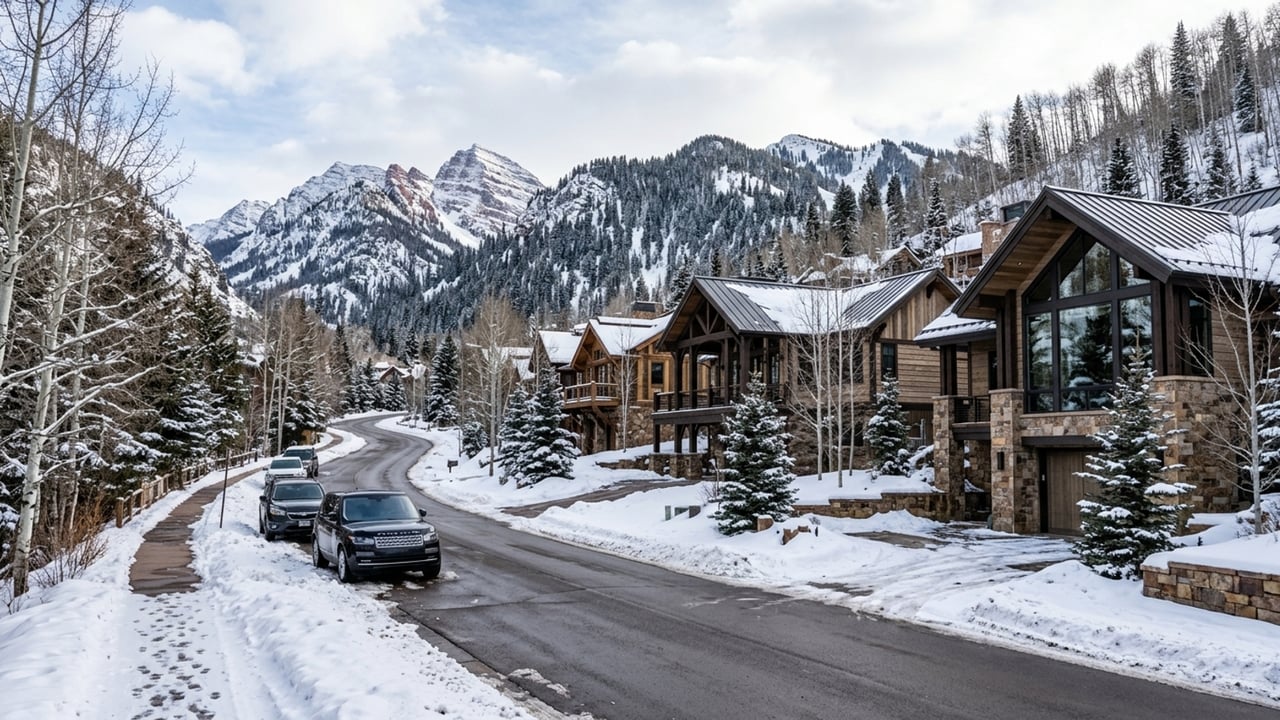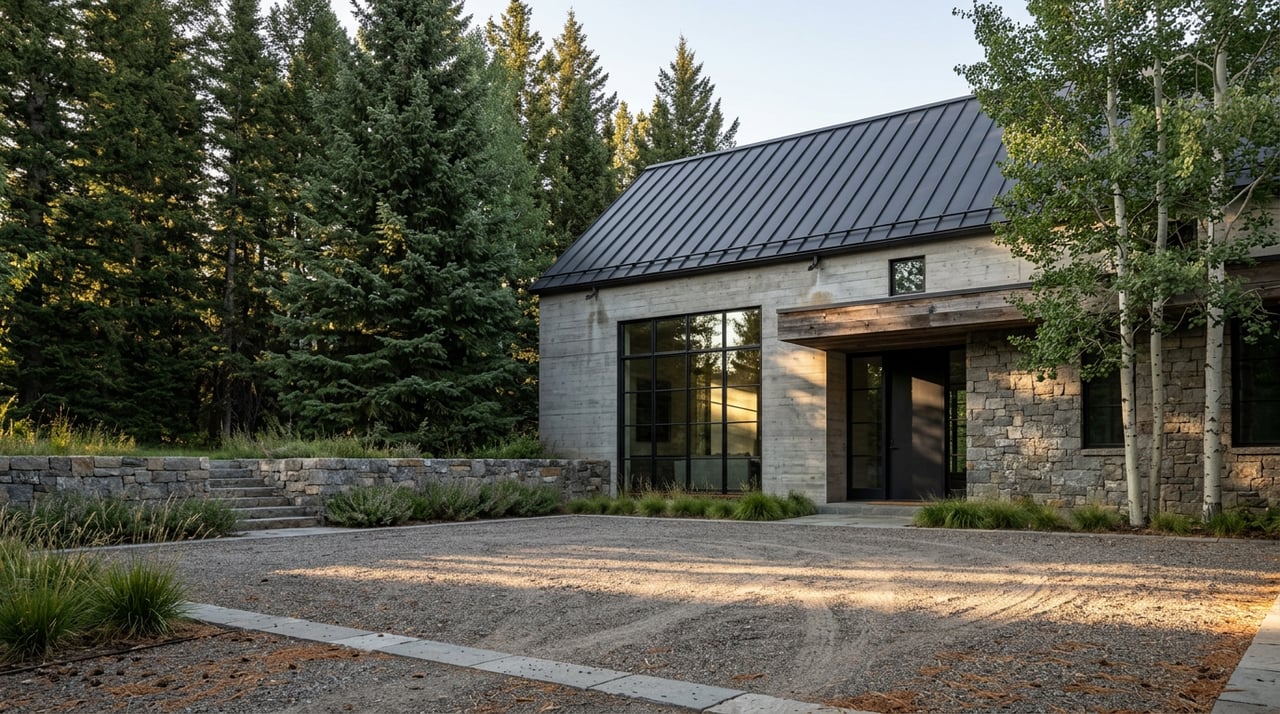
In April 2024, a house on Red Mountain sold for $108 million. It was 22,405 square feet, off-market, and closed without ever appearing on the MLS. The buyer was reportedly casino magnate Steve Wynn, alongside financier Thomas Peterffy. Riley Warwick of the Saslove & Warwick team at Douglas Elliman represented both sides of the deal. At $4,820 a square foot, it became the highest-priced residential sale in Colorado history.
That single transaction is still doing work in the market data today. If you've looked at Aspen's neighborhood price averages and noticed Red Mountain apparently lost $10 million in a year, that sale is the reason, and it is not telling you what you think it's telling you.
The Number That Looks Like a Decline
Red Mountain's average sale price fell from $32.09 million in 2024 to $22.38 million in 2025. On a chart, that reads like a correction. It isn't one. The 2024 average had one $108 million outlier sitting inside a small annual pool of estate-scale sales, and when a handful of transactions define an average, one number that large pulls the whole figure upward. Remove it, or simply let a year pass without a comparable sale, and the average snaps back toward what the neighborhood actually trades for.
Tim Estin, whose Estin Report tracks Aspen and Snowmass sales month to month, put the broader dynamic this way in the Aspen Times: "Aspen is globally desirable, supply-constrained and increasingly priced from the top down." The comp still matters, but on Red Mountain specifically, the comp set is thin enough that a single deal can swing the neighborhood's reported average by nearly a third. That's not a market losing value. That's a small sample size doing what small sample sizes do.
Four Neighborhoods, Four Different Prices
Aspen's citywide median is a blend of markets that don't move together. Here's how the four core neighborhoods compared from 2024 to 2025, by average sale price:
| Neighborhood | 2024 Average | 2025 Average | Change |
|---|---|---|---|
| Central Core | $6.32M | $8.47M | +34% |
| West End | $10.98M | $13.28M | +21% |
| East Aspen | $10.25M | $11.96M | +17% |
| Red Mountain | $32.09M | $22.38M | -30% |
Three of these four neighborhoods rose in the same period Red Mountain fell. The Core climbed on walkability and ski access. The West End climbed on demand for historic homes near the Aspen Institute and the Benedict Music Tent, the kind of buyer who wants a five-minute walk to Harris Concert Hall over a longer drive to slightly more square footage. East Aspen climbed as buyers priced out of the Core discovered they could still get the Roaring Fork River corridor without paying core-of-town prices.
Red Mountain didn't decline. It just doesn't have enough annual transaction volume to produce a stable average, which means a single ultra-estate sale, or the absence of one, moves the number more than it moves the market.
Why You Can't Build Your Way Out of Scarcity
Here's the detail that makes all four of these neighborhoods behave the way they do: the house that sold for $108 million could not be built today. At 22,405 square feet, it is more than double Pitkin County's current cap on new residential construction.
The regulatory floor under Aspen real estate has three moving parts, and they don't hit every neighborhood the same way:
- The city's Growth Management Quota System caps how much new residential square footage can be permitted each year, citywide
- Demolition allotments are limited to as few as six per year, which throttles the teardown-and-rebuild pipeline that would otherwise refresh aging inventory
- The maximum size for new construction has dropped from 15,000 square feet to 9,250 square feet, with Pitkin County's updated land use code taking effect in January 2026
On Red Mountain, where estate-scale homes were often built before these caps existed, this means the existing large houses are functionally irreplaceable. You cannot build a bigger one to compete with it. In the West End, the constraint layers differently: historic preservation rules protect the original Victorian footprint of many lots, so owners expand underneath through basement additions rather than up or out, a local practice known as a bustle. In the Core, the limiting factor is less about square footage caps and more about there simply being no more land within walking distance of the gondola.
Three different neighborhoods, three different reasons the supply can't catch up. That's why the price gap between them doesn't close, and why comparing them on price alone misses the actual driver of value in each one.
The Headlines Are Measuring Last Season, Not This Season
There's a second distortion worth understanding if you're watching Aspen market headlines this year. In March 2026, closed sales across Aspen fell 50% year over year, dropping from 24 the prior March to 12. Read on its own, that sounds like a market stalling out.
But in that same month, the number of properties going under contract doubled, from 14 a year earlier to 28. A closed sale in March reflects a decision a buyer made weeks or months earlier, once due diligence, financing, and title work run their course. A pending contract reflects what's happening right now. When those two numbers diverge this sharply, the closed-sale headline is describing a market that's already moved on.
Part of what's propping up seller confidence through that gap is how the deals get funded. Roughly 65 to 70% of all Aspen transactions close in cash, according to Estin's reporting in the Aspen Times, which means sellers aren't under the kind of financing-driven pressure that forces price cuts in more mortgage-dependent markets. A seller who doesn't need to sell can simply wait for the right buyer, and in a market where the majority of participants have that luxury, a slow month of closings doesn't automatically translate into softer pricing.
What This Means If You're Comparing Neighborhoods
If you're weighing Red Mountain against the West End, or the Core against East Aspen, the price gap between them isn't the useful data point. The useful question is what's actually scarce in each one, because that's what will hold or move the price over time.
Red Mountain's scarcity is acreage and irreplaceable square footage. West End's scarcity is walkable proximity to Aspen's cultural core layered with historic preservation limits. The Core's scarcity is simply land, full stop, inside a half-mile radius of downtown. East Aspen's advantage is that it offers river-corridor access without asking buyers to pay Core-level prices for it, which is exactly why it's been closing that gap.
Buyers who already own in one Aspen neighborhood and are shopping a second property nearby often assume their existing comps transfer. They usually don't. A price that looks aggressive on Red Mountain may be entirely rational once you account for the size cap that makes the existing home impossible to replicate. A price that looks soft in the West End may reflect a smaller lot that simply can't take a bustle addition under current preservation rules.
What Buyers Ask When They See These Numbers Side by Side
Does Red Mountain's falling average mean it's less desirable now? No. It means the neighborhood's small annual transaction count makes its average sensitive to whichever handful of sales close in a given year. One $108 million outlier in 2024 inflated that year's number, and 2025's more typical mix of sales looks like a decline only in comparison to an artificially high baseline.
If citywide closed sales were down 50% in March 2026, is this a weak time to buy? The pending contract count tells a different story. Twenty-eight properties went under contract that same month, double the year before. Closings lag decisions by weeks or months, so a slow closing month often reflects strong buyer activity from earlier in the quarter working its way toward the closing table.
Why does the West End cost less than Red Mountain despite being closer to downtown? Proximity isn't the only value driver here. Red Mountain sells acreage and privacy on irreplaceable lots. The West End sells walkability and cultural access on smaller, historically protected parcels. Both are scarce, but the underlying asset each buyer is paying for is different, and that's what separates the price tiers.
Where This Leaves You
Aspen's price story only makes sense once you stop treating it as one number. Four neighborhoods, four different scarcity mechanisms, and a market where the headline you read this month is usually describing a decision someone made last month. If you're trying to figure out what a specific Aspen neighborhood actually costs right now, and why, that's the conversation worth having before you start comparing listings.
If you'd like to talk through what these numbers mean for your specific search, whether that's the West End, Red Mountain, or somewhere in between, Jordie Karlinski is an Aspen native who works this market every day. Let's Connect.